Tired of paper and pencil questionnaires about integration and intergroup contact? Get beyond verbal self-report to a behavioral measure, try the new and improved EXPOSURE INDEX.
How integrated is your school, neighborhood, workplace, or military unit with respect to ethnicity, age, gender, class, political party, or other identity group? The EXPOSURE INDEX measures the degree of integration and compares it to expectations under random mixing. Repeated measurement of Exposure Index values over time can show whether integration/contact is decreasing, increasing, or stable.
Beta-testing of the EXPOSURE INDEX is now open! We invite you to email a data set (to cmccaule@brynmawr.edu) in the format used in the example below. We will email back calculated values of the Exposure Index and graphical representations of empirical sampling distributions showing the extent to which integration/contact is greater or less than chance.
The EXPOSURE INDEX is calculated from the proportions of identity groups appearing in social units. These units can be enduring (clubs, teams, workgroups, roommates) or transitory (clusters in lunch-table or classroom seating, sidewalk groups). Each Index represents the exposure of the average member of a given identity group to members of another identity group. For instance, for the average African American, what percent of his social unit is White? Or Asian? Or African-American? The sampling distribution for an observed value of the Exposure Index is calculated by randomly shuffling the members of each group into the observed units (number of and sizes), calculating the Index, and repeating 10,000 times to produce an expected distribution of Index values.
Here is an example similar to one used in the article that introduced the Exposure Index in Peace and Conflict: The Journal of Peace Psychology. This article is available here.
In this data set, each row is a unit (in this case a school lunch-table cluster).
In each unit, the first number is the number of Black students in the unit, the second is the number of White students, and the third the number of Asian students.
Blacks, Whites, Asians
3, 6, 10 10, 0
0, 1, 1
0, 8, 0
0, 1, 0
2, 0, 0
0, 4, 3
0, 4, 0
0, 9, 1
0, 6, 3
1, 3, 0
0, 3, 1
3, 0, 0
0, 7, 0
0, 2, 0
0, 12, 1
0, 6, 0
0, 10, 0
0, 6, 0
0, 7, 0
0, 11, 1
2, 7, 0
0, 6, 1
1, 7, 0
0, 4, 0
0, 5, 0
0, 6, 0
4, 7, 1
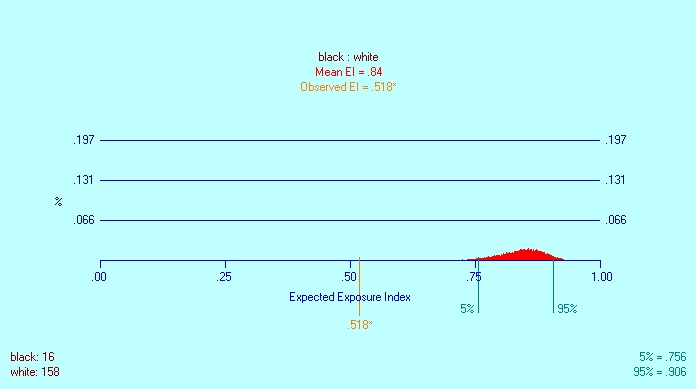
To take one example from this data set (see output graphic here), the observed Index for black exposure to white is .52. The expected Index (mean of sampling distribution) is .84. Thus the average black student is looking out at unit members (other than self) of whom 52% are white, whereas under random mixing the average black student would be looking out at unit members of whom 84% are white. Notice that 52% is significantly different from 84%: the 95-percent confidence limits for the sampling distribution are 76% and 91%.
Email us a data set like the one above (a comma-separated plain-text file, first row containing group designations), with up to 8 identity groups (columns) and up to 1000 units (rows). We will email you back graphical Exposure Index results for all identity group comparisons. Data sets received before 1 May 2011 will be analyzed free. If your data set shows up a problem in the Index program, we will repay your trouble with two free data set analyses after we have fixed the problem.
Try it! Send us some data!
Questions/comments to:
Clark McCauley (cmccaule@brynmawr.edu)
Joel Wallman (jawallman@gmail.com)
Jonathan Mordkoff (jonathan-mordkoff@uiowa.edu)